Blog #12 “Connectivity between GIS Research and Egyptian Studies”
2023.08.11
Category: Blog
Author: Sato Susumu
My research entails the use of maps. The main tool I use is a computer-based system called a “Geographic Information System”, or simply “GIS”. I use GIS together with statistical data and location-based spatial data to analyze demographic differences between regions. GIS also makes it possible to compare current map data with historical maps and aerial photography. I’ve been using old maps of Egypt to create new ones since before joining TUFS ILCAA. In this blog post, I will briefly describe Egypt as seen through maps by a GIS researcher.
The first location I’ll talk about is the village of Abu Senita. This village is well-known among Middle East researchers in Japan through the field studies of Hitotsubashi University Professor Emeritus Hiroshi Kato. If you’d like to learn more about the history of this village, I encourage you to read Professor Kato’s book (in Japanese), “Abu Senita Village: A Personal History of an Egyptian Village”. Let’s look at the topographic changes in the Nile River basin near this village.
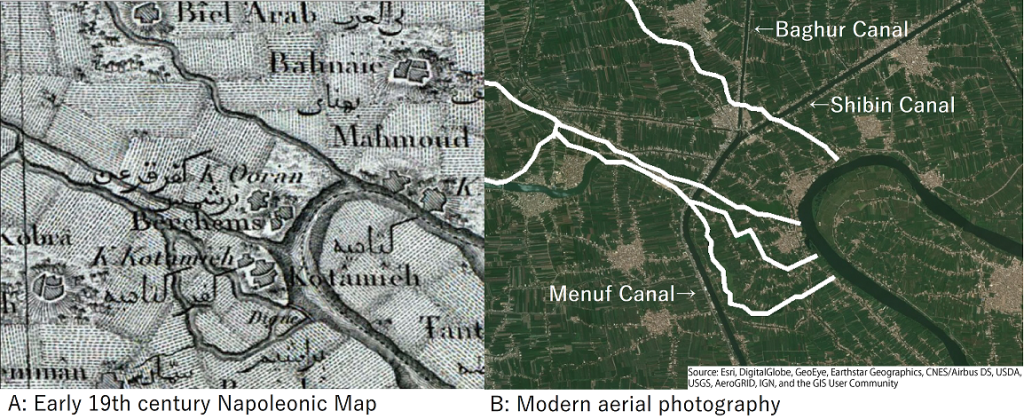
Comparing early 19th century Abu Senita against the area today.
Image A is an early 19th century Napoleonic map showing canals that no longer exist in modern aerial photography image B. Retracing the paths of the missing canals from map A onto modern photo B clearly shows the changes to the topography. What happened to the missing canals? The photo also shows three nearby man-made canals meeting in a Y-shape. These three canals had to have been added afterward, since they don’t appear on the Napoleonic map. The added canals allowed for year-round irrigation and improved agricultural production. But the introduction of these new canals also changed how water flows through the area, causing the now absent canals (traced in white) to dry up.
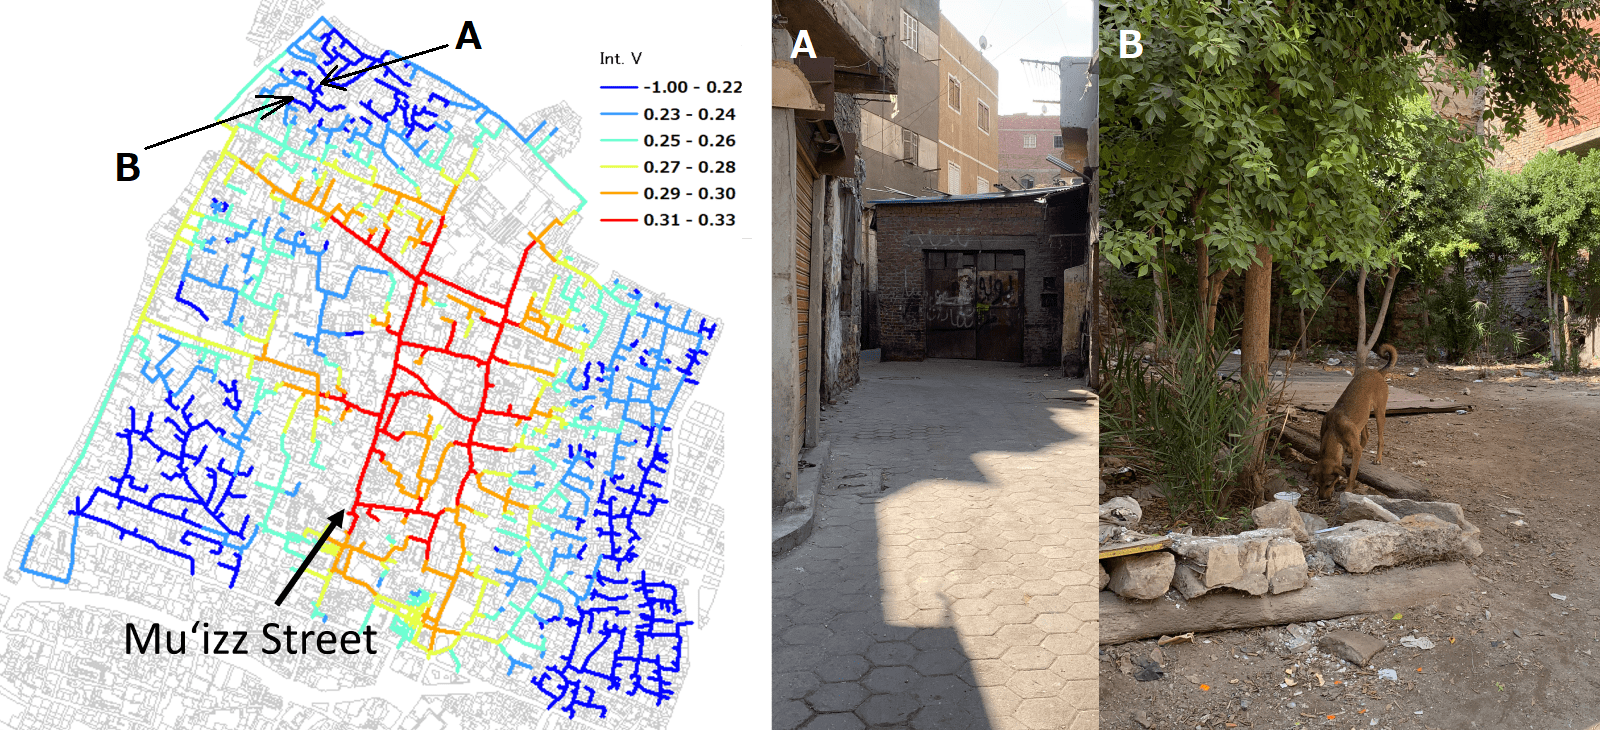
L: Accessibility map of streets in the Old Cairo district. R: The author’s photos of points A and B on the street map.
I’ve also produced a map of the inner areas of an Egyptian city. Above, on the left is a street map of the Old Cairo district, visualized using “space syntax” analysis, which shows the relative connectivity of the spaces within the district. To assess the street layouts, I digitized a 500:1 paper map produced by the Egyptian Ministry of Survey in 1938. The “Integration Values” shown on the map reflect each location’s “accessibility”, or connectivity to nearby streets and spaces. Roads shown in warmer colors (red, etc.) are more accessible, allowing more traffic and more varied traffic. Roads shown in cooler colors (blue, etc.) are relatively isolated. This visualization corroborated that Mu’izz Street, which runs north-south through the center of this district, functions as a central corridor of north-south connectivity. Also, the cooler colors indicate dead-ends and cul-de-sacs, as shown in example photos A and B on the right. I took these photos when I visited the district. These places genuinely looked deserted, as the analysis predicted, with few signs of active human activity.
As I mentioned, I took these photos during a recent visit to Egypt in December 2022. I was there in Hurghada to give a presentation at an international conference held by Egypt’s National Authority for Remote Sensing & Space Sciences. Most of the presentations dealt with remote sensing as used for environmental issues. I was particularly interested in the presentations on earthquakes. I was astonished to learn that earthquakes of level 5 on the Japanese seismic intensity scale, wherein cracks in soft ground begin to appear, have caused significant damage in Egypt. In earthquake-prone Japan, most buildings have been designed or retrofitted to withstand earthquakes, preventing major damage. (Nevertheless, the interior of a century-old building in Tokyo did collapse during the 2011 Tohoku earthquake.) Hearing about the damage in Egypt made me feel grateful for Japan’s anti-seismic technology advances, and also curious about the possibility of setting up a system so that Japan’s advances could be more readily applied in other countries. I was also surprised at how the conference was run. Things didn’t always go according to schedule. At this particular conference, the number of spoken presentations given was actually only about half of those planned. If this happened in Japan, the program would normally proceed according to schedule, with the absent presentation slots becoming free time. In Egypt, on the other hand, the subsequent presentations are moved up. There were four cancellations before my own presentation, which moved it more than an hour earlier than originally planned.
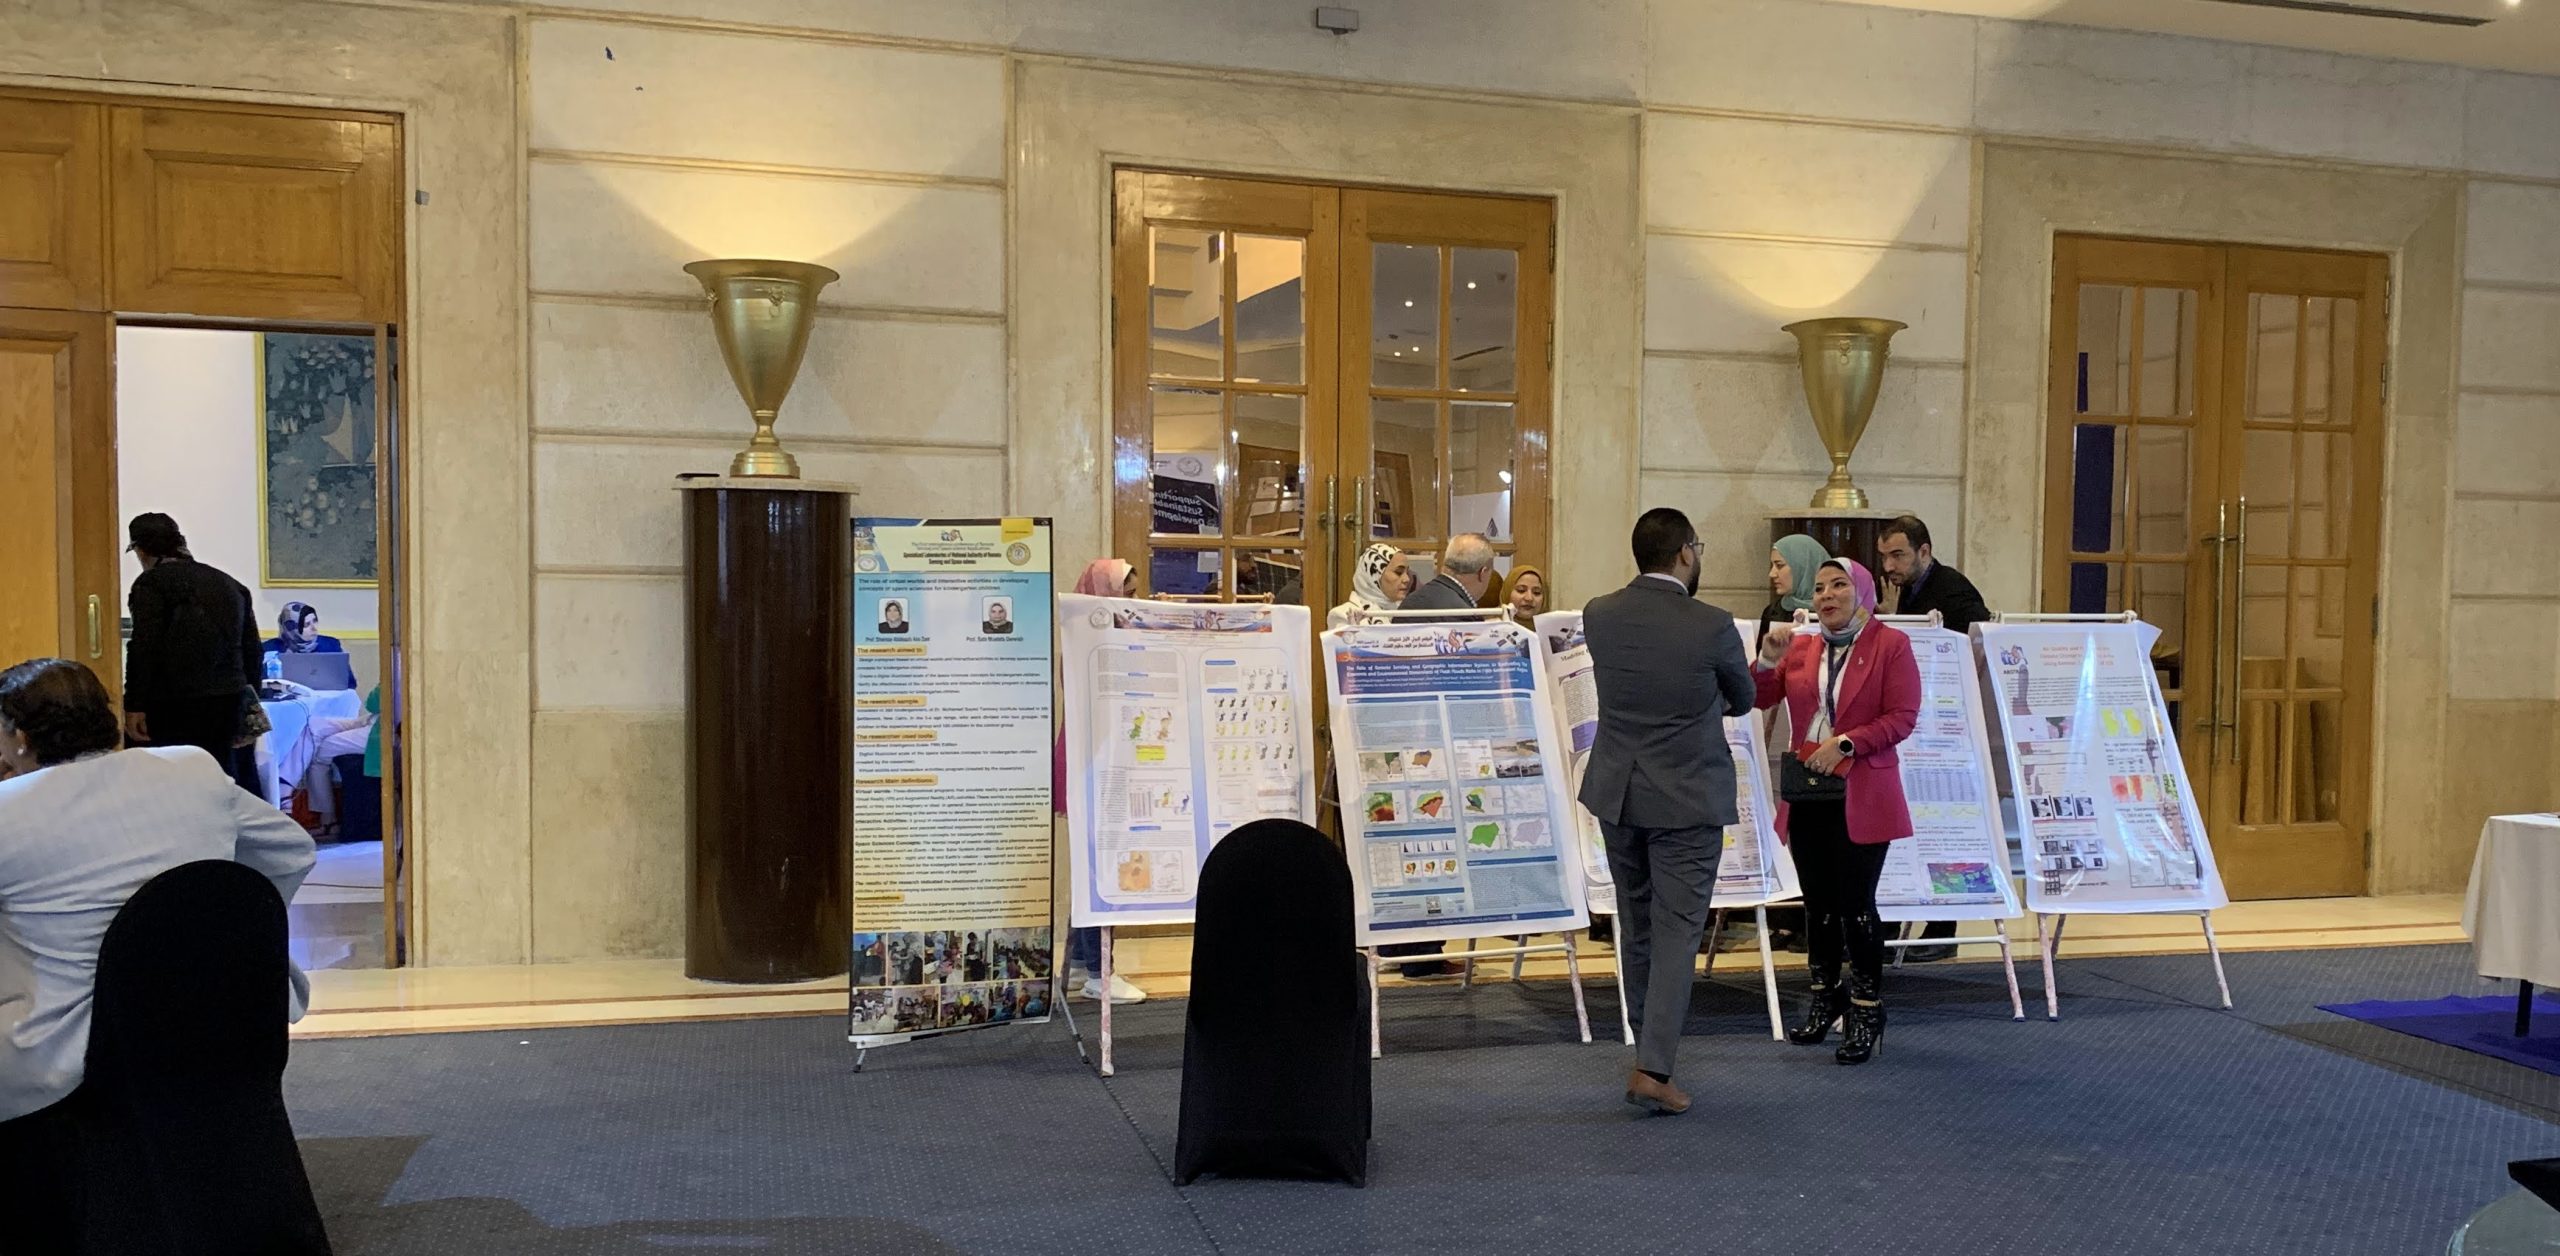
The poster room at the international conference in Hurghada.
In addition to my work on map-based studies of Egypt described above, in the second of my two years at ILCAA ending in March 2023, I was also involved in the management of historical maps of the Middle East, including Egypt, Turkey, and Syria. Aside from the field of History, I also happened to meet a primatologist in the same booth, and was involved in linguistics through ILCAA’s Information Resources Center. Still, I think my short two-year tenure at ILCAA coinciding with the COVID-19 pandemic limited my interactions with other fields. In April 2023, I relocated to start teaching and researching in Kanazawa, but intend to continue working with colleagues at TUFS ILCAA and, of course, the Islamic Trust Studies project.
* The Napoleonic map in the first figure was sourced as follows.
Panckoucke, C. L. F. 1826. Description de l’Egypte: Atlas géographique. Paris. (David Rumsey Map Collection).
Author profile

Sato Susumu(佐藤 将)
Lecturer, Faculty of Economics, Kanazawa Seiryo University
2021: Completed Ph.D. in Graduate School of Urban Social and Cultural Studies, Yokohama City University. Began working as a researcher at the Research Institute for Languages and Cultures of Asia and Africa, Tokyo University of Foreign Studies.
2023: Began working as a lecturer at the Faculty of Economics, Kanazawa Seiryo University.
Notable publication (in Japanese): “The Spatial Structures of Suburban Birth Rates: Kawasaki City” (Annual Report of the Japan Association for Urban Studies, #52, 2019).
Note
I use GIS technologies to study urban development issues. I’m particularly interested in the demographics of support for raising children. I mainly do research about Japan, but also sometimes involving other countries, such as visualizations of international relations or the GIS-based analysis of historical maps of Egypt described above.